reset
set term svg enhanced
set output "plot.svg"
set xdata time
set timefmt "%Y-%m-%d"
set xrange ["1945-1-1":"2000-1-1"]
set format x "%Y"
set xtics 5*31556926
set grid
#set title 'Atmospheric ^{14}CO_{2}'
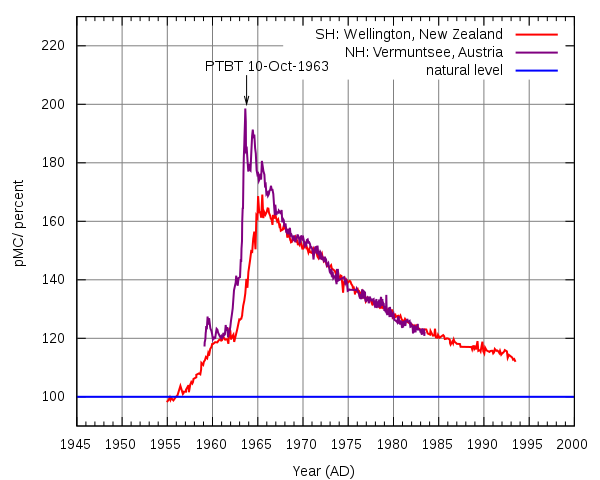
set xlabel 'Year (AD)'
set ylabel 'pMC/ percent'

#see Stuiver Polach for conversion between D14C and pMC

lambda = 1.0 / (8267 * 365.2422 * 24 * 3600)

set arrow from "1963-10-10", 210 to  "1963-10-10", 200
set label "PTBT 10-Oct-1963" at "1963-10-10", 210 offset -5,0.5

plot [][90:230] "<awk '!/*/{print \"19\" $1 \"-\" $2 \"-\" $3, mktime(sprintf(\"19%02i %02i %02i 00 00 00\", $1, $2, $3)) - mktime(\"1950 01 01 00 00 00\"), $6, $7;}' welling.195" us 1:(($3+1000)*exp(-lambda*$2)*0.1) tit 'SH: Wellington, New Zealand' w lines, "<awk 'BEGIN{FIELDWIDTHS=\"1 7 5 7 5 2 3 3 4 2 3 3 5 6 5 4 3 2 1\";} /^ HD-/{a = mktime(sprintf(\"19%02i %02i %02i 00 00 00\", $8, $7, $6)); b = mktime(sprintf(\"19%02i %02i %02i 00 00 00\", $12, $11, $10)); present=mktime(\"1950 01 01 00 00 00\"); printf \"%s %g %4g %2g\\n\", strftime(\"%Y-%m-%d\", (a+b)/2), (b-a)/2, b-present, $16, $18;}' vermunt.c14" us 1:(($4+1000)*exp(-lambda*$3)*0.1) tit 'NH: Vermunt, Austria' w lines, 100 tit 'natural level'
set output


